
Glossary entry
What Research Says About a Safe Withdrawal Rate at 55
Last verified 2026-07-26
This is not financial or legal advice. Medicare/Medicaid and benefits rules vary by state and change over time — verify current rules with your state Medicaid office or Area Agency on Aging.
Category: glossary-faq | Last verified: July 26, 2026
This article is for general educational purposes only and is not financial, tax, investment, legal, or health insurance advice. Retirement withdrawal decisions depend on taxes, portfolio construction, insurance costs, household income, state rules, and personal risk tolerance. Consider working with a qualified financial planner, tax professional, or benefits counselor before making irreversible retirement decisions.
For someone retiring at 55 with a balanced portfolio, the most defensible starting point is not one “safe withdrawal rate” but a planning band: roughly 3.3% to 4.2% for the first year, then adjusted from there based on inflation rules, spending flexibility, healthcare costs, and later Social Security income. That band comes from four different research lines: Morningstar’s 2026 30-year baseline, Bengen’s updated 50-year historical work, Kitces and Early Retirement Now on longer horizons and valuations, and Schwab’s forward-looking 30-year projections.[1][2][3][4][5]

A simple way to use the range is this: start near 3.3% to 3.5% if you want a conservative plan for a 40-plus-year horizon, elevated market valuations, or limited room to cut spending. A middle plan often lands around 3.7% to 4.0% if the portfolio is balanced, expenses are realistic, and Social Security will later cover part of the budget. The upper edge, around 4.0% to 4.2%, belongs to retirees with diversified portfolios, disciplined rebalancing, explicit spending cuts in bad markets, and a separately funded healthcare bridge.
Why 55 Changes the Question
The old 4% rule is usually discussed around a 30-year retirement. Retiring at 55 can stretch the portfolio job to 35, 40, or even 45 years. That does not automatically make 4% reckless, but it does make the assumptions matter more: asset mix, valuation at retirement, inflation, rebalancing, taxes, insurance premiums, and whether spending can drop during market stress.
The first danger is copying a 30-year number into a 45-year plan. The second danger is treating the portfolio as if it must fund every dollar forever, even when Social Security may later take over part of the spending load. Morningstar’s 3.9% baseline, for example, excludes Social Security and other non-portfolio income, so it measures the portfolio’s ability to support withdrawals by itself under its stated assumptions.[1]
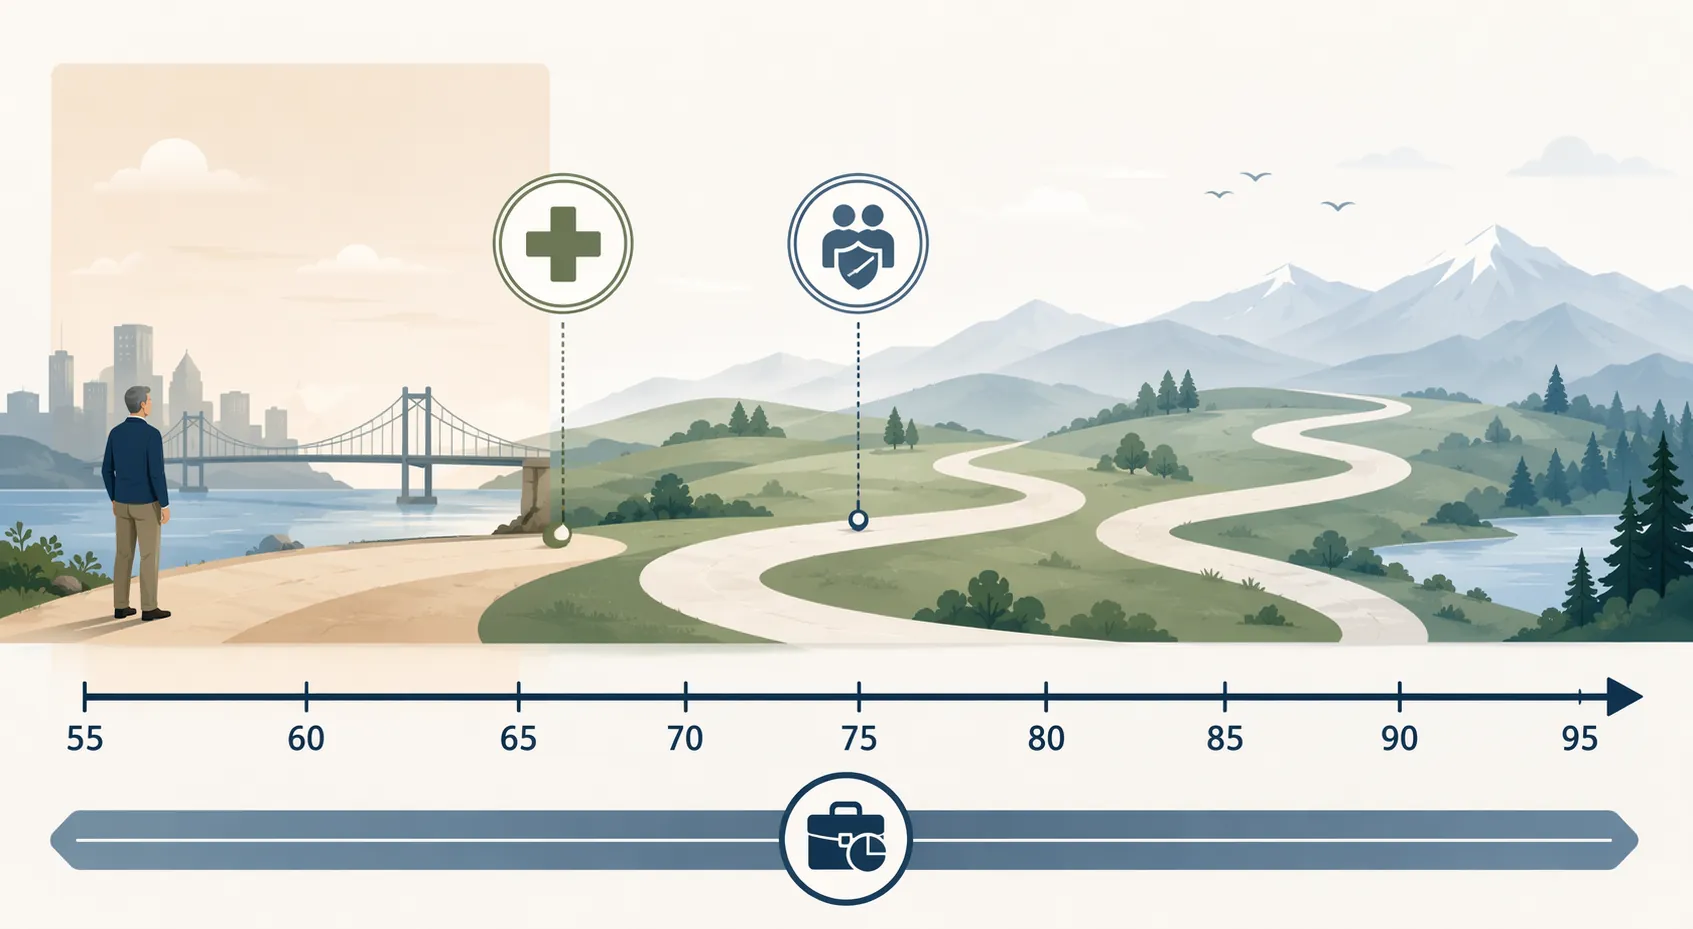
That distinction is especially important from 55 to 65. A 55-year-old retiree is not just asking whether a portfolio can survive a long retirement. They are asking whether it can survive the most expensive bridge years before Medicare, while also keeping taxable income low enough to avoid turning health insurance into a second mortgage payment.
What the Main Research Programs Actually Say
Morningstar’s 2026 estimate gives a 3.9% safe starting withdrawal rate for a 30-year retirement with a 90% probability of success, up from 3.7% in 2025 because its capital market assumptions improved. Its research points to a 30% to 50% equity allocation as the “sweet spot” for that baseline. Morningstar also notes that flexible or guardrails-based strategies can lift starting rates toward 6%, but only if the retiree accepts year-to-year income volatility.[1]
For a 55-year-old, Morningstar’s 3.9% is useful but incomplete. It is not a 45-year number, and it does not solve the Medicare gap. Still, it anchors the middle of the range because it is current, conservative about success probability, and explicit about the tradeoff between fixed real spending and flexible spending.
Bengen’s 2025 update sits higher for the familiar 30-year case: 4.7%. But the more relevant age-55 figure is his 4.2% estimate for a 50-year horizon, based on a 55% stocks, 40% bonds, and 5% cash portfolio with regular rebalancing. His worst-case calibration remains tied to the 1968 retirement cohort.[2]
That 4.2% deserves attention, but it is not portable to every portfolio. A retiree sitting mostly in cash, concentrated stock, long-duration bonds, or an unrebalanced allocation cannot simply borrow the number. It is a historical result inside a specific portfolio design, and the portfolio design is part of the answer.
The lower edge of the planning band comes from longer-horizon and valuation-sensitive work. Kitces-related analysis cited by Mad Fientist shows the safe withdrawal rate falling from 4.1% over 30 years to 3.5% over 45 years, with little additional decline beyond roughly 40 to 45 years.[3] Early Retirement Now’s CAPE-based work points to about 3.25% to 3.50% when elevated valuations are part of the starting conditions.[4]
That is why the lower end should not be treated as pessimism for its own sake. It is the price of asking a portfolio to last through a very long horizon when starting valuations may already be demanding. A 55-year-old who wants fewer spending cuts later has to leave more margin at the start.
Schwab’s 2026 analysis provides a useful forward-looking check rather than the age-55 answer by itself. Its current low-return assumptions produce a 4.2% to 4.8% range for a 30-year moderate portfolio.[5] That does not make 4.8% a sensible default for a 45-year retirement, but it does show that forward-looking models have not pushed reasonable 30-year starting rates far below the old rule.
| Research source | Most relevant figure | What it helps answer | Main caution for age 55 |
|---|---|---|---|
| Morningstar 2026 | 3.9% for 30 years with 90% success probability | A current baseline for fixed real withdrawals | Not built as a 45-year healthcare-bridge plan |
| Bengen 2025 update | 4.2% for 50 years with 55% stocks, 40% bonds, 5% cash | A historical upper anchor for a long horizon | Depends on the stated allocation and rebalancing |
| Kitces / Early Retirement Now | About 3.25% to 3.50% under long-horizon or valuation-sensitive assumptions | The conservative floor for long retirements | Can feel too restrictive if the retiree has strong flexibility or later income |
| Schwab 2026 | 4.2% to 4.8% for a 30-year moderate portfolio | A forward-looking 30-year reasonableness check | Does not define the safe rate for 40-plus years |
Turning the Research Into a 55-Year-Old’s Planning Band
The 3.3% to 4.2% range is not an average of the studies. It is a translation. Morningstar supplies a current 30-year midpoint. Bengen supplies a long-horizon historical upper anchor under a defined allocation. Kitces and Early Retirement Now explain why the floor moves toward the mid-3s when the time horizon extends and valuations matter. Schwab confirms that current forward-looking assumptions still leave room for moderate 30-year rates, while not removing the age-55 caution.
On a $1,000,000 portfolio, the band means an initial annual withdrawal of about $33,000 to $42,000 before taxes and before any later adjustment method. On a $1,500,000 portfolio, it means about $49,500 to $63,000. Those examples are arithmetic illustrations, not a recommendation, and the taxes can be very different depending on whether the money comes from taxable accounts, traditional retirement accounts, Roth accounts, or cash.
- Use 3.3% to 3.5% if the plan must survive a very long horizon with limited flexibility, high fixed expenses, or concern about elevated valuations.
- Use 3.7% to 4.0% if the portfolio is balanced, expenses are realistic, and later Social Security or pension income reduces the portfolio burden.
- Use 4.0% to 4.2% only if the portfolio design resembles the assumptions behind the stronger studies and the retiree can cut discretionary spending in down markets.
The spending rule also matters. A fixed inflation-adjusted withdrawal is the hardest version to sustain because it asks the portfolio to keep paying the same real amount after bad markets. A flexible guardrails plan can start higher because it allows spending to fall when the portfolio falls. That is not a free raise; it is a willingness to accept smaller withdrawals at inconvenient times.
The Healthcare Bridge Can Decide Whether the Rate Works
For a 55-year-old, the portfolio model and the health insurance model have to sit on the same page. Before Medicare, ACA benchmark Silver plans for a 55-year-old can run roughly $1,000 to $1,800 per month without subsidies because age rating can make premiums up to three times the rate charged to a 21-year-old. Enhanced premium tax credits expired at the end of 2025, and managing modified adjusted gross income around the 400% federal poverty level threshold — about $62,600 for a single person — can save more than $800 per month in some cases.[6]
Those figures vary by state, county, household size, plan choice, and income. The practical point is narrower: a withdrawal rate that looks safe before health insurance may fail after health insurance. Anyone retiring at 55 should price coverage in their own ACA marketplace and use a subsidy calculator rather than relying on a national estimate.
This is where Roth, traditional, taxable, and cash withdrawals stop being a tidy tax-planning chart and become monthly cash flow. Traditional 401(k) or IRA withdrawals generally increase taxable income. Roth withdrawals generally do not increase modified adjusted gross income. Taxable accounts may create capital gains depending on cost basis. A retiree who blindly pulls from traditional accounts could raise MAGI enough to reduce ACA subsidies, while a retiree with Roth or cash reserves may be able to fund part of the bridge without the same subsidy impact.
That does not mean Roth withdrawals are always best. It means the withdrawal order should be tested against health insurance premiums, not just income tax brackets. The “safe withdrawal rate for retirees at 55” is partly a portfolio question, but during the 55-to-65 window it is also a benefits question.
Social Security Changes the Portfolio’s Job
Morningstar’s baseline excludes Social Security and other non-portfolio income, which is clean for research but easy to misread in a household plan.[1] A 55-year-old who expects Social Security at 67, 70, or another claiming age may not need the portfolio to fund full lifetime spending. The portfolio may need to cover a bridge: larger withdrawals before Social Security begins, then lower portfolio withdrawals afterward.
That bridge can justify a different-looking withdrawal pattern than a flat inflation-adjusted rule. Some retirees may intentionally spend more from the portfolio before Social Security, especially if delaying benefits improves later lifetime income. Others may claim earlier to reduce pressure on the portfolio. The safer choice depends on health, household longevity, survivor benefits, taxes, and market conditions, so the withdrawal rate should be modeled with the claiming date rather than bolted on afterward.
A plan that ignores Social Security can be too harsh. A plan that assumes Social Security will rescue an overstretched portfolio can be too loose. The useful middle is to show the year-by-year gap: spending need, portfolio withdrawal, healthcare premium, tax estimate, and expected non-portfolio income when it begins.
A Practical Decision Frame
For a 55-year-old with a balanced portfolio, the planning decision usually belongs inside three zones:
- Conservative: 3.3% to 3.5% when the retirement horizon may run 40 to 45 years, valuations are a concern, fixed expenses are high, or the retiree has little appetite for cutting spending after market losses.
- Moderate: 3.7% to 4.0% when the portfolio is broadly diversified, the budget includes taxes and insurance, and Social Security or another income source later reduces the portfolio’s workload.
- Flexible upper range: 4.0% to 4.2% when asset allocation, rebalancing, and spending rules are disciplined, healthcare costs are planned separately, and discretionary spending can fall during weak markets.
The number to distrust is the one that arrives alone. A 55-year-old plan should show the withdrawal rate, the market assumptions behind it, the healthcare bridge before Medicare, the income threshold exposure for ACA subsidies, the tax source of each withdrawal, and the year Social Security enters the cash-flow picture. Without those pieces, “safe” is doing too much work.
References
- What’s a Safe Retirement Withdrawal Rate for 2026?, Morningstar, link
- Bill Bengen’s New Safe Withdrawal Rate: A 17.5% Raise For Retirees, Forbes, Oct 2025, link
- Safe Withdrawal Rate, Mad Fientist, link
- Safe Withdrawal Rate Series, Early Retirement Now, link
- The 4% Rule: How Much Can You Spend in Retirement?, Schwab, 2026, link
- Retiring at 62? Early Retirement Health Costs, Boldin, link
Browse more in the Glossary.