Caregiver decision guide
States Where Social Security Cuts Hit Seniors Hardest
This article identifies the U.S. states where seniors rely most heavily on Social Security income, and shows how a projected 24% benefit cut would devastate household budgets — particularly in Mississippi, West Virginia, and other high-dependency states across the South and Midwest.
A 24% Social Security cut would take about $500 a month from the average $2,053 monthly benefit, using the June 2026 Committee for a Responsible Federal Budget scenario.[1] That is the starting point for understanding the states most affected by Social Security cuts for seniors: not as a Washington percentage, but as the part of the month when the utility bill, prescription refill, car insurance, rent, or grocery total still has to be covered.
That cut has not happened. It is a projection tied to Social Security trust-fund depletion, and estimates differ; the CRFB scenario is used here because it is recent and gives state-level impact estimates. The point is not to treat one projection as a personal guarantee. The point is to ask where a cut of that size would leave seniors with the least room to maneuver.
Where Social Security Is Closest to the Whole Budget
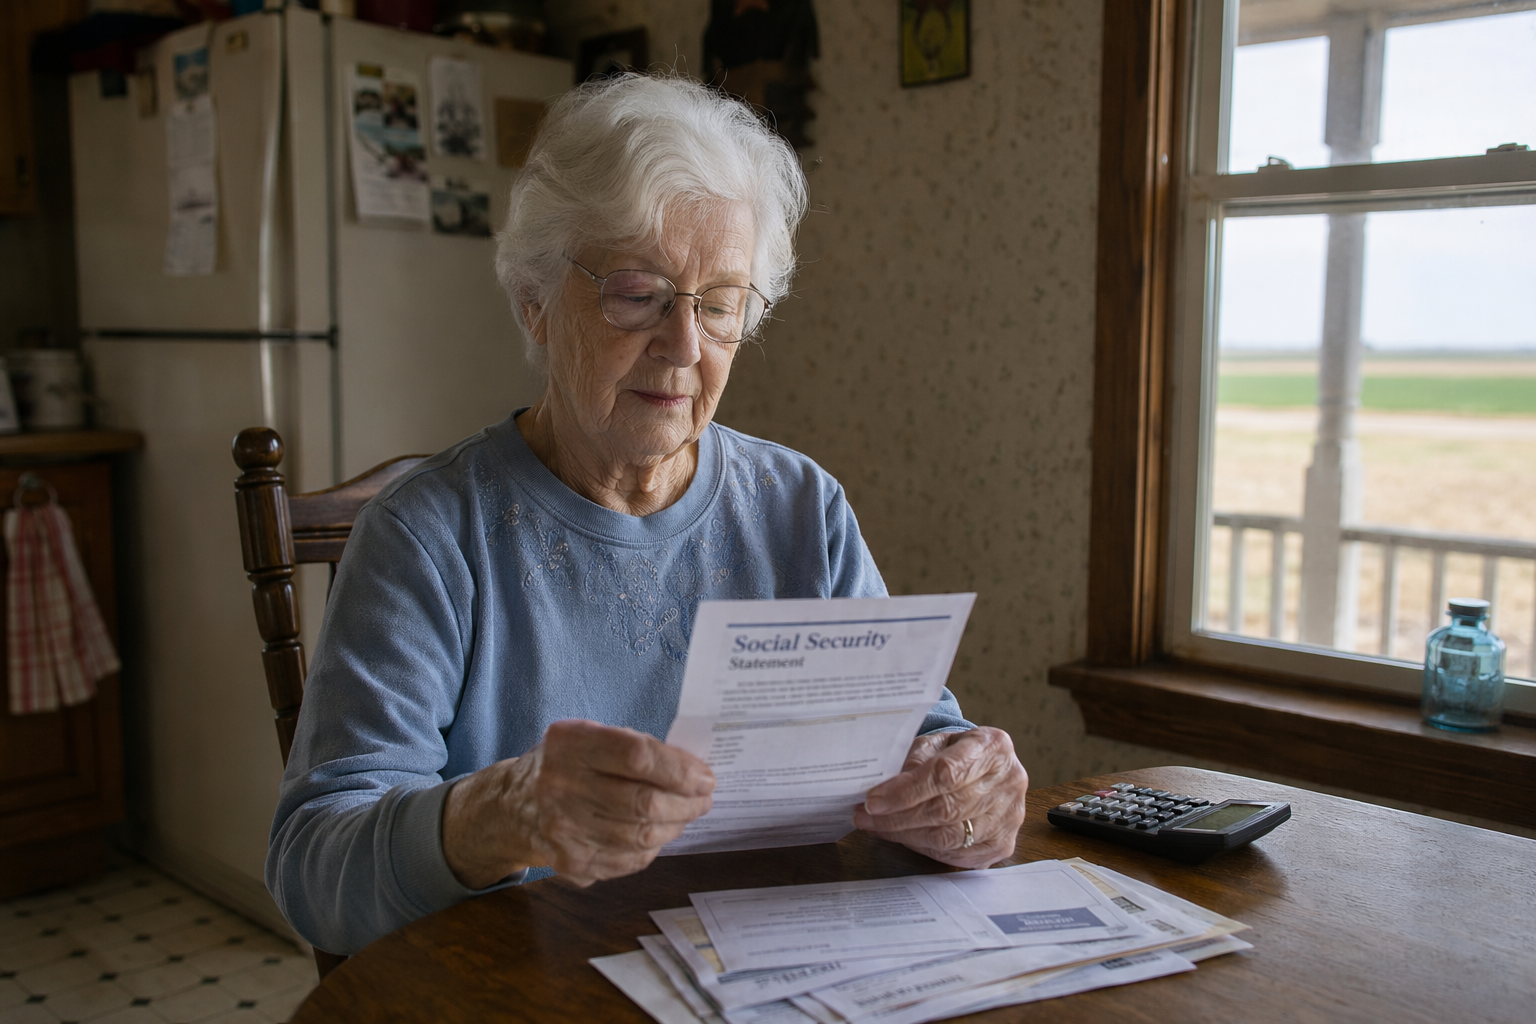
A $500 monthly loss does not mean the same thing in every household. For a retiree who has a pension, rental income, investments, or a spouse still working, Social Security may be painful to lose but not the whole financial structure. For a senior whose check is already carrying food, utilities, Medicare premiums, supplemental insurance, transportation, and help from relatives, the same cut reaches the kitchen table faster.
That is why dependency matters. The Senior Citizens League estimated in 2026 that 24.6 million seniors, equal to 44% of the retirement-age population, depend on Social Security for 100% of their income.[2] For those households, “finding another source” is not a simple budgeting suggestion. It may mean an adult child covering a bill, a prescription going unfilled, a credit card balance growing, or a senior delaying a repair that keeps the house safe.
| Rank | State | Share of senior income from Social Security |
|---|---|---|
| 1 | Mississippi | 49.5% |
| 2 | West Virginia | 49.0% |
| 3 | Kentucky | 47.6% |
| 4 | Indiana | 47.4% |
| 5 | Arkansas | 47.1% |
| 6 | Louisiana | 46.6% |
| 7 | Alabama | 45.8% |
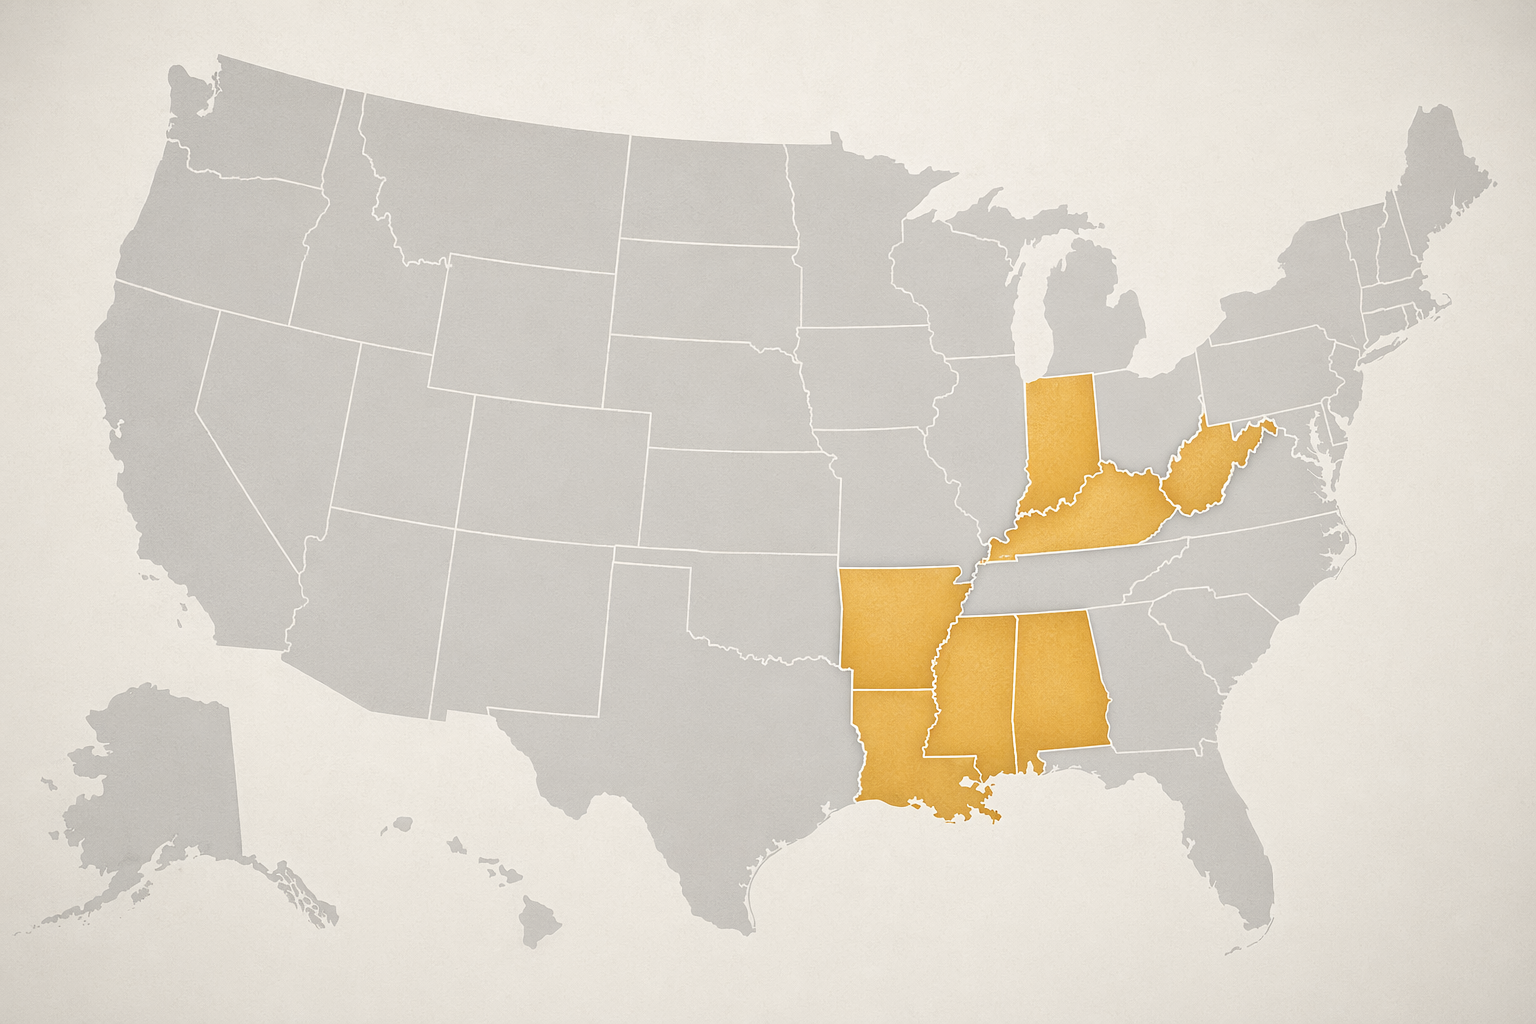
Mississippi sits at the top of the dependency ranking, with Social Security making up 49.5% of senior income. West Virginia follows at 49.0%, then Kentucky, Indiana, Arkansas, Louisiana, and Alabama, all above the mid-40% range.[3] This is the group where a benefit cut is least likely to be absorbed quietly, because the check is already doing close to half the household’s income work.
Why Mississippi and West Virginia Stand Out
Mississippi’s ranking is not only about the percentage. The state’s median senior income is about $44,000, compared with a national average near $60,000.[3] When income is already lower, a smaller missing amount can be harder to replace. A senior with less retirement savings, a smaller pension history, or no paid work option left does not have many clean ways to make up a few hundred dollars every month.
West Virginia shows the same problem from another angle. Social Security payments equal 16.5% of total state personal income there, according to Economic Policy Institute analysis. In Mississippi, the figure is 14.7%.[4] That does not mean every household is in the same situation, but it does show that Social Security is unusually important not only to seniors, but to the flow of money through local communities.
In towns where older residents spend Social Security income at the grocery store, pharmacy, utility office, auto shop, and church fundraiser, a cut does not stay inside one checkbook. It can mean less money moving through places that already have thin margins. The first harm is still personal: the older adult deciding what gets paid. But the local weight of Social Security helps explain why West Virginia and Mississippi deserve more attention than their population size alone might suggest.
The Highest Dollar Loss Is a Different Ranking
There is another way to rank the states: by the size of the average benefit and therefore the dollar amount lost under a percentage cut. On that measure, higher-benefit states can look more exposed. CBS News, covering the CRFB report, noted that Connecticut would face the largest average monthly dollar loss under the 24% scenario.[5]
That is a real loss, and it should not be waved away. A retired couple in a high-cost state can be squeezed hard even if their benefit is larger on paper. Housing, taxes, health costs, and long-term care expenses can make a bigger check disappear quickly.
But highest dollar loss and highest dependency risk answer different questions. Connecticut may show a larger average dollar cut because benefits are higher. Mississippi and West Virginia show a more dangerous income structure because Social Security makes up nearly half of senior income. If a parent’s benefit is one of several income sources, a cut hurts one part of the budget. If that benefit is the financial foundation, the whole month has to be rebuilt.
The Southern and Midwestern Cluster
The dependency map is not random. Mississippi, West Virginia, Kentucky, Indiana, Arkansas, Louisiana, and Alabama form a Southern and Midwestern cluster where Social Security carries a larger share of senior income.[3] These are also places where some older adults have fewer backup options: lower lifetime earnings, less retirement-plan coverage, fewer assets to draw down, and family networks that may be financially stretched themselves.
For an adult child living two states away, that geography matters. A parent may say the bills are handled because the Social Security deposit arrives on time. What may be missing from that answer is the amount of informal support already holding the month together: a nephew mowing the yard, a daughter covering an insurance premium, a neighbor driving to the clinic, or a church pantry filling the gap near the end of the month.
A cut would not automatically push every senior in these states into crisis. Some have pensions, savings, paid-off homes, adult children nearby, or lower housing costs. The risk is that a larger share of seniors in these states start from a budget where Social Security is doing more of the lifting. When the main support is reduced, the replacement has to come from somewhere else, and there may not be many places left to look.
What a Caregiver Should Look For
The state ranking is useful, but it cannot tell you whether one parent is safe. The better use is as a starting point for a more specific conversation. If a parent lives in Mississippi, West Virginia, Kentucky, Indiana, Arkansas, Louisiana, Alabama, or a similar high-dependency state, the next question is not whether the state is “bad.” It is how much of that parent’s actual monthly income depends on one federal deposit.
- Add up every reliable monthly income source: Social Security, pension payments, retirement-account withdrawals, wages, rental income, and regular family help.
- Separate fixed bills from flexible spending: rent or mortgage, utilities, insurance premiums, debt payments, prescriptions, groceries, transportation, and phone service.
- Estimate what a roughly 24% Social Security cut would remove from the month, using the current benefit amount rather than a national average.
- Identify which bill would go unpaid first if that amount disappeared.
- Check whether the backup plan is real money, available help, or only a hope that family can step in.
That last step is often the uncomfortable one. Many older adults do not describe unpaid family labor as financial help, even when it is. If a son drives to appointments because there is no affordable transportation, that is part of the budget. If a daughter pays for a prescription refill twice a year, that is part of the budget. If a sister covers the electric bill during a hot month, that is part of the budget too.
A Simple Household Test
A practical test is to remove one quarter of the Social Security check on paper and then try to pay the same bills in order of necessity. Start with housing, utilities, medication, insurance, food, and transportation. If the budget fails before the end of that list, the household is highly exposed to a benefit cut, no matter what the state average says.
This does not require a perfect spreadsheet. It requires knowing the deposit amount, the bills that cannot wait, and whether there is another reliable income source. For many families, the first useful discovery is not the exact shortfall. It is realizing that the parent has been treating irregular help from relatives as if it were a stable safety net.
What the Projection Can and Cannot Tell You
The CRFB 24% figure is a scenario, not a statement that every beneficiary’s check will be cut by that amount on a set date. Social Security projections can change if Congress changes taxes, benefits, borrowing rules, or the trust-fund outlook. Other estimates, including those from the Social Security Trustees and the Congressional Budget Office, place the potential reduction at different levels.[1]
The state dependency data also has limits. The FinanceBuzz analysis cited in the dependency rankings uses Census Bureau American Community Survey data from 2022 through 2024.[3] Rankings can shift as income, migration, wages, and retirement patterns change. A state average also hides differences inside the state: a retired teacher with a pension, a widowed renter, and a couple with paid-off farmland can live in the same county and face very different risks.
There is also not enough state-level evidence here to claim that a Social Security cut would directly cause a specific rise in senior homelessness or evictions in Mississippi, West Virginia, or any other state. The evidence supports a narrower and still serious conclusion: where seniors depend more heavily on Social Security, a large benefit cut would create a sharper household-budget risk.
How to Read the Map
If the question is where seniors would lose the most dollars on average, look at higher-benefit states. If the question is where seniors may have the fewest alternatives when a Social Security check shrinks, look at dependency. On that second question, Mississippi, West Virginia, Kentucky, Indiana, Arkansas, Louisiana, and Alabama deserve close attention.
A parent in one of those states is not automatically in crisis. But a family should treat Social Security cuts as a serious household-budget risk if the check is close to the whole financial foundation. The hardest-hit states are not simply the places where checks are largest. They are the places where there may be little else underneath them.
References
- No State Spared, Committee for a Responsible Federal Budget, June 2026
- New TSCL Study Estimates 24.6 Million Seniors Get By on Social Security Alone, The Senior Citizens League
- Map Shows States That Depend Most on Social Security Checks, Newsweek
- Southern and Midwestern Districts Are the Most Vulnerable to Social Security Cuts and Disruptions, Economic Policy Institute
- Social Security Trust Fund Depletion Could Trigger Benefit Cuts by State, CBS News
Questions to bring to a clinician or OT
This is not medical, legal, or a family's final decision — only a framework. Bring these questions to a clinician, occupational therapist, or your local Area Agency on Aging.
Find Local HelpRelated reading
Noticed something outdated or inaccurate on this page? Flag a correction. We review every report against CDC, NIA, and AARP HomeFit guidance before updating a page.