
Glossary entry
Why the 2026 Social Security COLA Is Lower Than Expected
Last verified 2026-07-30
This is not financial or legal advice. Medicare/Medicaid and benefits rules vary by state and change over time — verify current rules with your state Medicaid office or Area Agency on Aging.
The official 2026 Social Security cost-of-living adjustment is 2.8%. On paper, that is not an unusually low number; it is close to the recent long-run average of 2.6% over the past 20 years. But that is exactly why the number irritates many retirees. “Normal” inflation history does not answer the question sitting on the kitchen table: why does the benefit notice rise by 2.8% when the pharmacy counter, rent renewal, homeowners insurance bill, grocery receipt, and utility statement seem to be moving faster? [1]
The short answer is that the COLA is not calculated from a retiree spending basket. It is calculated using the Consumer Price Index for Urban Wage Earners and Clerical Workers, known as CPI-W. That index reflects inflation for working-age urban wage earners and clerical workers, not specifically for people living on retirement benefits. For a fuller walkthrough of the formula and the quarterly data window, see how the Social Security COLA is calculated.

The number is official. The spending basket is the problem.
Social Security benefits are inflation-adjusted through annual COLAs, and those COLAs are based on CPI-W. CPI-W covers only about 29% of the U.S. population because it is tied to urban wage earners and clerical workers rather than all households or older households specifically. That does not make it fake. It makes it a poor mirror for many retirees’ actual spending. [2]
A working household and a retired household can both experience “inflation,” but not in the same places. A worker may be more exposed to commuting costs, payroll-related expenses, child-related costs, or education. A retiree may be more exposed to Medicare premiums, prescriptions, out-of-pocket medical care, rent, property taxes, home insurance, repairs, utilities, and paid help that makes it possible to keep living safely at home.
That distinction matters because a COLA is not a reimbursement for whatever rose in your own life. It is a formula-driven adjustment based on a national index. If your biggest bills are categories that carry less weight in CPI-W than they do in your own budget, the official COLA can be historically ordinary and personally inadequate at the same time.
| Index | What it is meant to reflect | Why seniors notice the difference |
|---|---|---|
| CPI-W | Inflation for urban wage earners and clerical workers | It is the index used for Social Security COLAs, but it is not built around retiree spending patterns. |
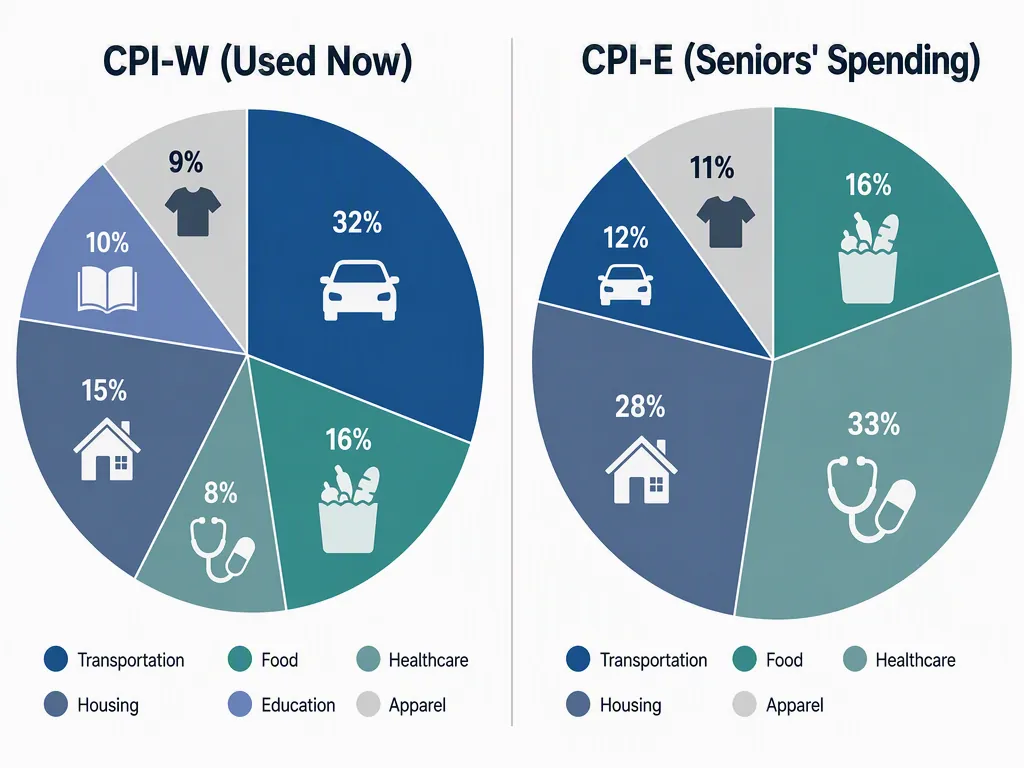
| CPI-E | Inflation for households where the reference person is age 62 or older | It gives more weight to the spending patterns of older households, especially categories such as healthcare. |
Healthcare is where “average inflation” starts to feel least average
The most obvious mismatch is healthcare. Older households spend a larger share of their budgets on healthcare than the CPI-W basket reflects; the research range often cited for seniors is roughly 13% to 15% of spending. CPI-W gives healthcare a lower weight because its population is still tied to working households. When medical care, prescription drugs, premiums, or out-of-pocket costs rise faster than the broader basket, retirees feel the gap quickly. [2]
This is also why some retirees see two different COLA stories in the same month. The gross Social Security benefit may rise, but the amount available to spend can be squeezed by Medicare premiums or other healthcare costs. The Center for Retirement Research has separately noted that higher Medicare premiums can eat up more than 25% of a Social Security COLA in some years, which is the kind of detail that disappears when people talk only about the headline percentage. [3]
Healthcare pressure also does not stop at the doctor’s office. A higher copay can mean postponing a refill. A less generous plan can mean rechecking whether a preferred provider is still affordable. For readers watching Medicare plan changes, the same fixed-income pressure shows up in discussions of Medicare Advantage benefit cuts. The COLA formula does not decide those plan details, but a small COLA leaves less room to absorb them.
Housing and aging-at-home costs make the mismatch harder to shrug off
Housing is the other place where the benefit notice can feel detached from real life. Rent increases, property taxes, insurance, repairs, utilities, and maintenance do not arrive as one neat inflation category in a retiree’s checkbook. They arrive as separate bills, often at different times, and many of them are hard to cut without real consequences.
For older homeowners, staying put can be cheaper than moving into assisted living, but it is rarely free. Grab bars, safer flooring, better lighting, stair modifications, paid help, transportation, and emergency-response tools all compete with food and medical costs. When the COLA trails the household’s actual pressure points, the trade-off is not abstract. It can affect whether a home remains safe enough to live in. For a closer look at that side of the budget, see the hidden costs of aging in place.
This is the part many official explanations skip too quickly. They tell people the COLA follows inflation. They may even show the historical average. But they do not always say plainly that the index behind the adjustment is not measuring the lived budget of a retired widow, a couple managing chronic conditions, or an adult child helping a parent keep the lights on and the prescriptions filled.
Would CPI-E fix it?
CPI-E, the Consumer Price Index for the Elderly, is the most common alternative raised in this debate. It tracks households where the reference person is age 62 or older, so it is closer to the way older households actually spend. It gives more weight to categories that matter more in later life, including healthcare. That is a real improvement in concept.
But it is not the dramatic one-year fix that some people imagine. Social Security’s Office of the Chief Actuary estimates that using CPI-E instead of CPI-W would raise the average annual COLA by about 0.15 to 0.20 percentage points. That is meaningful over time, but in a single year it would not turn a tight budget into an easy one. [4]
This is where the math is both modest and important. A fraction of a percentage point does not look like much on one notice. Over many years, however, each slightly higher adjustment becomes part of the base for the next year’s adjustment. The effect compounds. A retiree who is already choosing between home repairs and dental work does not need a lecture on compounding, but the policy point is worth making: small annual mismatches can become a large loss of buying power.
The Senior Citizens League’s 2024 Loss of Buying Power study illustrates that cumulative problem. It found that Social Security COLAs increased benefits by 64% since 2000, while typical retiree expenses rose by 130%, which the organization described as a 40% loss of buying power. That finding should not be treated as the only word on the subject, but it captures something retirees recognize immediately: the gap builds year after year. [5]
The counterargument: CPI-W may be an imperfect middle ground
There is a serious counterargument, and it should not be waved away. The Center for Retirement Research at Boston College has argued that the current CPI-W functions as a reasonable compromise because it sits between CPI-E, which tends to produce higher COLAs, and the chained CPI, which tends to produce lower ones. In that view, changing the index may not be the clean solution advocates hope for. [6]
That argument is useful because it prevents an easy oversell. CPI-E is better aligned with older households, but the official actuarial estimate says the annual increase would usually be small. CPI-W is not a senior-specific index, but it is not randomly chosen either. The real issue is that a “good compromise” in an institutional chart can still feel thin when a retiree’s nonnegotiable costs are rising faster than the benefit.
This also helps explain why two people can look at the same 2.8% COLA and reach different conclusions. A budget analyst may see a number near the historical average. A retiree may see that the increase does not cover the pharmacy, rent, and utility changes already in motion. Both observations can be true because they are measuring different things.
Why the official number and the amount you feel are not the same
The official COLA is a gross percentage increase. Your lived COLA is what remains after the bills that rise at the same time. That is why a benefit increase can look acceptable in a press release and still feel disappointing in a checking account.
- If Medicare-related costs rise, part of the increase may be absorbed before it helps with groceries or utilities.
- If rent, insurance, or property taxes rise faster than the COLA, the housing budget takes the increase first.
- If prescriptions or medical visits become more expensive, the COLA may protect health spending while leaving less for everything else.
- If the household depends almost entirely on Social Security, even a historically normal COLA may not create breathing room.
There is another source of confusion: estimates versus final numbers. Before an official COLA is announced, news stories and calculators often discuss projected dollar increases. Those are not the same as the final Social Security notice. If you are comparing headlines with actual benefit amounts, it helps to separate projection talk from confirmed figures; the same issue comes up in explanations of whether a $77 Social Security increase is confirmed and in discussions of why a COLA can be smaller than it looks.
Why the formula has not changed
Proposals to switch Social Security COLAs from CPI-W to CPI-E have been introduced, but the change has not become law. The obstacle is not just whether CPI-E better reflects older households. It also raises long-term program costs, because higher COLAs compound through future benefit payments. [7][4]
That is where the debate often stalls. People living on benefits are asking whether the adjustment matches their costs. Lawmakers and actuaries also have to account for the program’s long-term financing. Those are different problems, and neither disappears by pretending the other one is minor.
For a household trying to plan, the practical lesson is limited but useful: do not assume the COLA will match the categories that dominate an older person’s budget. It is a broad inflation adjustment based on CPI-W. If healthcare, housing, utilities, insurance, or home-safety expenses are your fastest-rising costs, the COLA may lag your real life even in a year when the official percentage is historically normal.
The 2026 COLA is not unusually low by historical standards. It can still be structurally inadequate for seniors because the index behind it does not fully match how retirees spend. That is the difference between an average inflation number and a budget that has to work by the end of the month.
References
- SSA 2026 COLA Fact Sheet, SSA
- Are Social Security Benefits Inflation-Adjusted?, Investopedia
- Higher Medicare Premiums Will Eat Up More than 25% of Social Security's COLA, Center for Retirement Research at Boston College
- SSA Office of the Chief Actuary CPI-E estimates, SSA Office of the Chief Actuary
- Social Security Benefits Lose 40% of Buying Power, The Senior Citizens League
- Social Security's COLA: Let's Not Mess with the Index, Center for Retirement Research at Boston College
- Social Security COLA Formula Fails Retirees, Legis1
Browse more in the Glossary.